


Written by: Eugene Steuerle
The Misleading Treasury Bond Controversy
The focus should be on the higher real interest rate applying to the enormous stock of federal debt.
Bond markets are in the news these days. The Wall Street Journal, for instance, just headlined (yesterday, September 2) that “Treasury Yields Hit New Highs As World Leaders Squabble At Fractured G-20.” A little over a week before, on August 24, Stanley Druckenmiller criticized his protégée, Secretary of the Treasury Bessent, for buying back and reducing the share of longer-term securities sold by the Treasury. In reaction, the Secretary has continued to defend his engineering within the Treasury bond market, arguing that it was still among the strongest in the world.
I have found much of this give-and-take uninformative. The issues that they raise are very real, but they have long predated today’s squabbles and the latest Treasury yield. Let me explain.
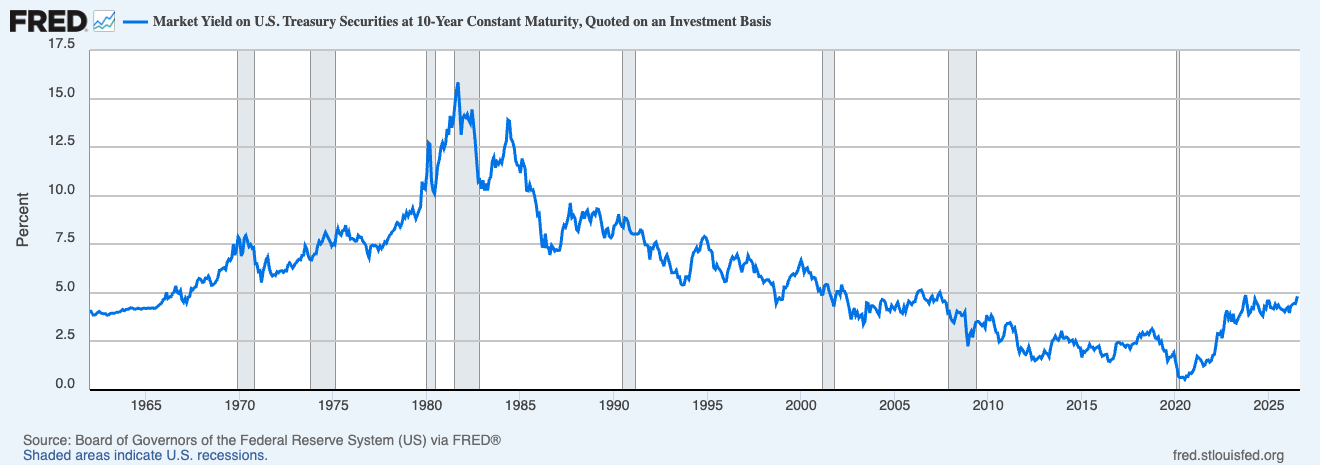
Among the many problems with many press reports is inattention to longer-term trends. For instance, one has to dig beyond the Wall Street Journal headline to find out that the “high” to which they refer is for the “10-year Treasury yield [rising] to its highest level since President Trump began his second term.” By making comparisons mainly to recent years, these reports over-dramatize how high the rate has become and hint that the solution is somehow to go back to where we were a few years ago. Yet this century’s rates have been kept quite low, partly due to monetary policies pursued worldwide in a period from the Great Recession to the COVID-19 crisis. On the flip side, focusing on today’s nominal, but not real, inflation-adjusted rates of return downplays the extent to which the real rate of interest had already zoomed up in 2002 and 2003.
Here’s the rub. While nominal and real rates have both moved toward traditional, long-term, historical levels, the nation’s debt now sits at levels far above anything seen in our history, except during World War II. At four times its level as a percent of our income or GDP in the mid-1970s, we are finally starting to reap the costs of Santa Claus fiscal and monetary policies sown over the past few decades. No legerdemain by the Secretary of the Treasury—that is, adjusting the share of federal liabilities between long-term and short-term borrowing—will get around that problem. As buyers of these securities become less confident in the security of our nation’s promises to honor our debt and efforts to maintain a stable currency, the threats to economic stability at home and abroad only get worse.
Below, I provide data that clarify this history.
Historic comparisons of the long-term rate
Let’s start with the graph at the top of this page. Using 10-year Treasury securities as the base for comparison, it is clear that this security’s interest rate was above 5 percent almost every year from the late 1960s to the early 2000s. The current movement of this band rate toward 5 percent simply puts it in a more normal range.
Real rates of interest
There’s a lot more going on. Centering in on the period from 2021 onward, the three lines in the next graph are (1) the same nominal return shown above, (2) the real rate of return on Treasury inflation-indexed bonds (TIPS) of the same maturity, and (3) the breakeven inflation rate, which is the difference between these two yields,* based on buyers’ expectations at the time of purchase*.
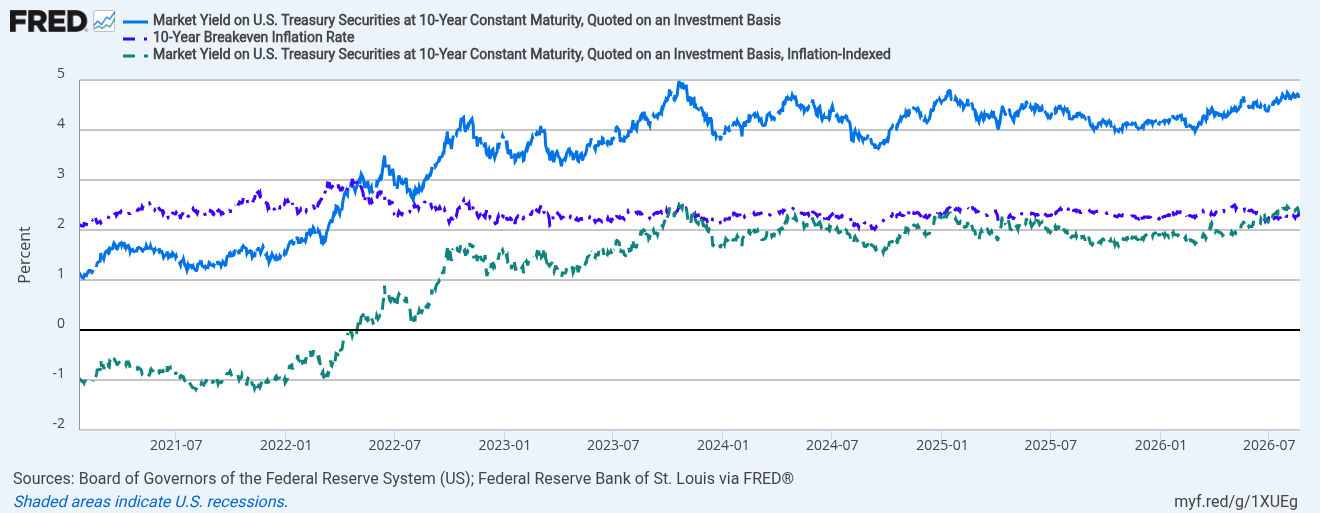
In 2021, the real rate of return offered to new buyers was negative. It then increased rapidly in 2022, with another significant boost in 2023. Since then, it has hovered around 2.0 percent, occasionally rising to near 2.5 percent. Today, it sits near its all-time high, though TIPS have been offered consistently only since 2010. The real rate of return on the 30-year TIPS, in turn, has been hitting new all-time highs of about 3.0 percent (not shown).
Meanwhile, the “breakeven inflation rate” has stayed steadily above 2.0 percent and very recently has bumped up toward 2.5 percent, reflecting buyers’ belief that the Federal Reserve will keep inflation near, but on average a bit above, its long-stated goal of 2.0 percent. The combination of the high real return and projections of inflation staying above Federal Reserve targets has led to higher nominal rates than in the recent past.
Bessent’s Bet: borrow more short-term, hoping that interest rates might fall or at least won’t rise
Looking further, the next graph helps explain why the Secretary is interested in increasing the share of Treasury debt that is short-term. This graph compares the graph you saw at the beginning—the nominal interest rate, or market yield, paid on 10-year Treasury securities at the time of sale—with the average interest rate paid on all of the Treasury’s debt. They are not equal, not just because the latter contains bonds of different maturities, but because it averages the rate paid on all outstanding securities, not just those sold at a point in time.
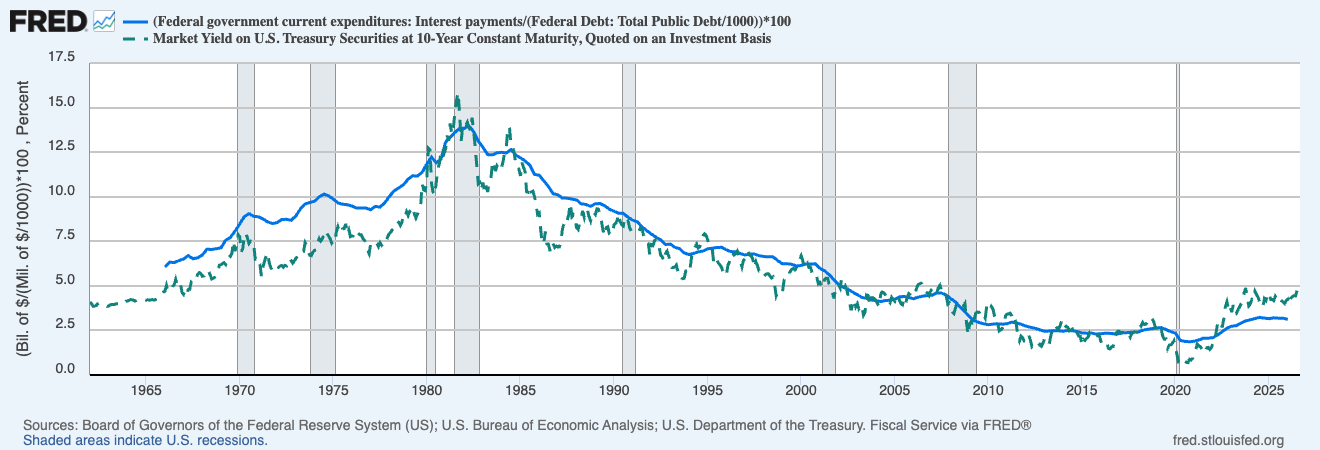
The Secretary is placing the same type of bet you would make if you paid off part of your longer-term mortgage with new short-term debt that would roll over at new rates for periods as short as six months. If his gamble goes wrong, we will end up paying a lot more on the nation’s old debt as it rolls over, not just the new debt.
The far right side of the graph shows something quite unusual over almost all the 65-year periods shown. New 10-year Treasury bonds now pay an interest rate well above the average for all securities. In effect, new bond sales pull up the average rate as older, lower-rate securities mature, and the Treasury replaces them with newer, higher-rate securities. Note that this is just the opposite of the case from the early 1980s until just a few years ago: as new securities were sold then, not only was the interest rate on the new debt due to new deficits lower, but the interest rate on much old debt declined as well as it rolled over. In a sense, declining rates over many recent decades helped Congress hide the budgetary consequences of the deficits it was incurring and would still be paying interest on decades later. Now the total interest cost of federal debt is rising at a significantly faster rate than the rate of increase in the national debt.
Pete Davis of Davis Capital Investment Ideas, a friend who tracks government actions for the financial markets, offers a nice summary of how all this relates to the latest controversy:
Zero real borrowing costs from 2010 to 2020 led to more borrowing. Worse, the Treasury didn’t take advantage by doing more 10- and 30-year borrowing to lengthen the curve, which would have saved taxpayers billions. Then, the fact that Secretary Bessent ignored the last TBAC (Treasury Borrowing Advisory Committee) recommendation to lengthen the curve [that is, put less emphasis on shorter-term securities] left a sour taste in the markets. His recent buyback was met with much derision. So, we’re going to have a tug-of-war between Treasury and the markets, which, as you know well, the markets always win at taxpayer cost.
